Introduction
An ECG (electrocardiogram) is a diagnostic tool that records the electrical activity of the heart. It is often considered the gold standard for identifying normal or abnormal heart function.
Understanding the waves and what they represent is the first step in mastering ECG interpretation. Each wave provides information about the heart’s electrical activity and function and is core in clinical practice.
Waves of the ECG
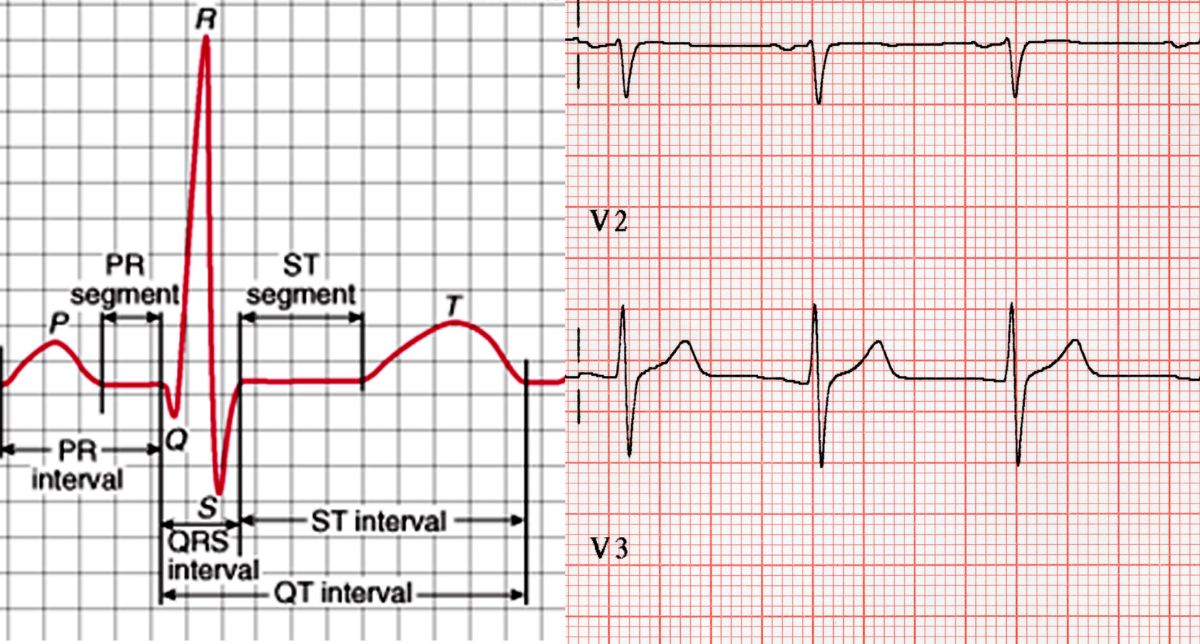
The ECG is comprised of five main waves: P, Q, R, S, and T. These waves represent different phases of the heart’s electrical conduction and give information of the heart when viewed in different leads or perspectives.
What Each Wave Represents
P Wave: Atrial Depolarization
The P wave represents atrial depolarization, occurs when the atria contract.
It has two halves:
First half: Represents the right atrium.
Second half: Represents the left atrium. In a normal ECG, the two halves are equal and opposite in magnitude.
QRS Complex: Ventricular Depolarization
The QRS complex is the depolarization of the ventricles. It is made up of three parts:
1. Q Wave
The first downward deflection after the P wave is the Q wave.
It can represent septal depolarization or a pathological finding.
If the Q wave is longer than 1/3 of the R wave’s height, it may indicate a previous myocardial infarction (MI).
2. R Wave
The first upward deflection after the P wave.
It is the primary wave of the QRS complex and indicates ventricular depolarization.
3. S Wave
The downward deflection following the R wave.
The point where the S wave meets the isoelectric line is called the J point.
Clinical significance:
J point elevation: Seen in ST-Elevation Myocardial Infarction (STEMI).
J point depression: Seen in Non-ST Elevation Myocardial Infarction (NSTEMI).
T Wave: Ventricular Repolarization
The T wave reflects ventricular repolarization.
Abnormalities in the T wave are often indicative of electrolyte imbalances:
Hypokalemia: Flattened or inverted T waves.
Hyperkalemia: Peaked T waves.
Understanding what each wave represents, is the foundation for accurately interpreting ECGs and identifying a wide range of cardiac conditions.